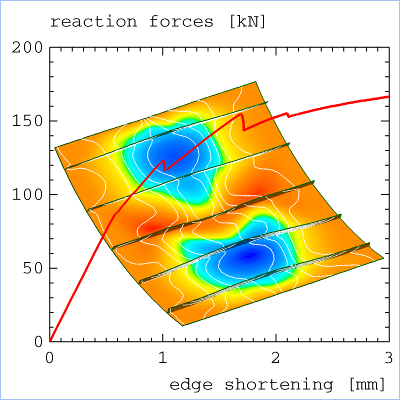
In this chapter, the objects for performing basic x/y-plotting,
are described. x/y-plotting consists of three steps: (1) Obtain the x-
and y-data, (2) put those data into one or more
Curve objects and put those objects into a
Graph object. Finally, make adjustments to the
display settings of the Graph object and of the
Curve objects.
Here, we are concerned with steps 2 and 3. Note that, for CSM
(computational solid mechanics) and CFD (computational fluid mechanics),
the specialized HistoryXYPlot and
DPTools objects perform all three steps for many
standard tasks. Further, these objects have a GUI, while at least for
the Curve object, some Python scripting is
necessary.
However, these specialized objects also make use of the
Curve and Graph objects to
display the x/y-data.
The following classes are of relevance to x/y-plotting:
-
The
Graphobject is a container for one or moreCurveobjects. Like aPart, it can be displayed in aScene. TheGraphobject consists of an x- and a y-axis, for which start and endpoints, the number of intervals, sub-intervals, etc. can be specified or left to theGraphobject to determine automatically (the default). The axes scales can be inverted, and logarithmic scaling for the axes is also possible. Finally, a host of display settings is available. -
The
Curveobject is a container for a list of pairs (x,y). It also stores attributes, like colour, line width, symbol type and size etc. With this object, scatter, line, and bar plots, or a combination of those, can be made. For eachCurveobject, a label (a character string) can be defined. TheCurvelabels are displayed together in theGraph's area.
The following simple example demonstrates the use of several
Curve objects in the same
Graph object.
# Define data ranges.
x1 = [-1.0 + 2.0 / 100 * i for i in range(101)]
y1 = [x**2 for x in x1]

x2 = [-1.0 + 2.0 / 20 * i for i in range(21)]
y2 = [x**3 for x in x2]

# Create two Curve objects and initialize them.
c1 = Curve()
c1.extend(zip(x1, y1))
c1.label  = 'x^2'

c2 = Curve()
c2.extend(zip(x2, y2))
c2.colour      = 'blue'
c2.symbol.type = 'cross'
c2.label       = 'x^3'

# Create the Graph object and add the Curve objects.
g = Graph()
g.xaxis.label = 'x'
g.yaxis.label = 'y'
g.add(c1)
g.add(c2)
When executing this script, the Graph
object automatically computes the start and end values for the x- and
y-axes.


